Graphic Organizers
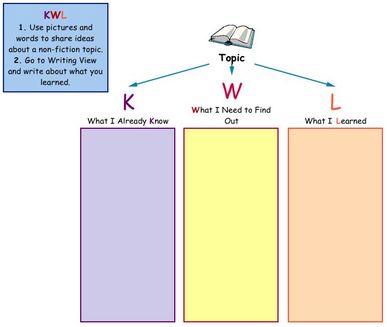
The term graphic organizers refers to visual representations that assist students who don’t understand English very well. Echevarria, Vogt, & Short describe them as “schematic diagrams of key concepts and other information, and children use them to organize the information they are learning.” (p. 128, 2014) There are many examples of graphic organizers that can be used. Venn diagrams, timelines, KWL chart, and sequence chart are just a few. Some other specific uses for graphic organizers are to structure writing projects, help in problem solving, decision making, studying, and brainstorming (Houghton Mifflin Harcourt).
Graphic organizers can also help students develop higher level thinking skills and promote creativity (Haynes, 2004). The reason graphic organizers can be so effective for ELL students is because of the various types there are. You can adapt graphic organizers for different levels of English learners. Even if a student is considered an English learner, that doesn't mean every student is the same and requires the same differentiation.
This particular strategy is one you can teach students to use on their own. Many graphic organizers can be created fairly easily in a student's notebook or on a piece of paper. Do not just implement the use of graphic organizers as a whole class activity. If this happens, students will assume it is only something used in a whole group setting and completed together.
The main content area this strategy could be used for is in reading or literacy. Graphic organizers can be used for identifying main idea, comparing and contrasting character traits, or finding the plot or theme. When reading, there can be a lot of information to comprehend. Graphic organizers make it easier to process information. A good book to use with younger students that includes using a graphic organizer are the “If you give a mouse a cookie” books. These books are great for looking at compare and contrast. You can use a Venn Diagram or similar graphic organizer with these books.
Another content area where graphic organizers can be adapted is in science. In almost any experiment you do, you have observations that you must write down and record. Various kinds of graphic organizers can be used to record details, compare experiments, and come to a conclusion. KWL charts can be very helpful because when doing a science experiment or just learning about a topic in science students usually have some knowledge to begin with. They can many times formulate what they would want to learn, and then finally record their findings.
A third content area in which graphic organizers can be effective is in math. In doing mathematics students need to be able to organize their thoughts and strategies. Various graphic organizers such as a KWL chart or Venn Diagram can help students with this. According to AMLE, “Graphic Organizers help students organize and clarify their thoughts, infer solutions to problems, and communicate their thinking strategies.” (2009) Essentially, students can translate the process of thinking into pictorial or graphic format.
