Visualization
Visualization is an effective strategy in all subject areas, but is very popular when teaching reading comprehension strategies. Using the visualizing strategy, English learner students are able to connect what they are reading and the pictures in their head.
According to Goudvais and Harvey in Strategies That Work (2007), students who visualize as they read have a richer experience and can better remember what they have read for longer periods of time. With this strategy, the teacher could provide a prompt and ask the students to visualize in their minds and focus on sensory images.
Using pictorial representations, ELL students are able to interpret the pictures using minimal linguistic skills, but rather emphasizing visual literacy. According to Dr. Norman Herr in 2007, visual literacy is the ability to evaluate, apply, or create conceptual visual representations. Visualization is fairly independent of language and is effective for learning content and English simultaneously.
An example of a pictorial representation is a graphic organizer. Graphic organizers are diagrams or maps that show the relationship between new and prior concepts, encouraging incorporation of new ideas. Graphic organizers involve minimal language. Some examples of useful graphic organizers are Venn Diagrams, flow charts, and concept/mind maps.

This strategy would be particularly useful when teaching science, reading, and mathematics. To use this strategy when teaching science, the teacher could use a visual representation such as a chart or graph to communicate concepts using minimal language. Symbols are universal to most languages. The use of these visual aids help to communicate complex and content-specific language to ELL students in a universal, visually literate way.
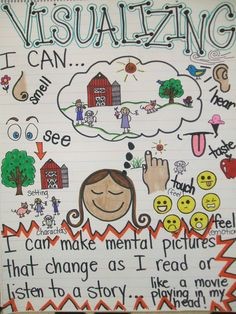
When using this strategy for teaching reading, the use of anchor chart would be especially useful. The teacher would model this strategy for the students, emphasizing how students can make a “movie” in their heads as they listen to a story or read a story. While the teacher is reading a story, the students will be asked to close their eyes and imagine what is happening in the story. Then they will be asked to draw what they imagined in their head.
According to Judie Haynes (2014), you can integrate mathematics into the reading lesson mentioned above, as well. This lesson would be most appropriate for 2nd grade. To do this, the teacher would read the book, The Doorbell Rang to the students. The students would close their eyes and visualize what they are hearing in the story. Next, they will draw what they visualized. After the drawings are shared, the students examine the next page in the book, which shows 12 chocolate chip cookies. The teacher then explains that the “movie” in our heads can change when we receive more information. Using visualization for The Doorbell Rings book shows students how 12 chocolate chip cookies can be divided by 2 children, then 3 children, then 4, and then 6 children. At the end, 12 children end up sharing the cookies. The students then can use paper cut out cookies to represent sharing 12 cookies between different numbers of groups. This helps students to conceptualize partitive division through concrete learning experiences using the visualization technique.
